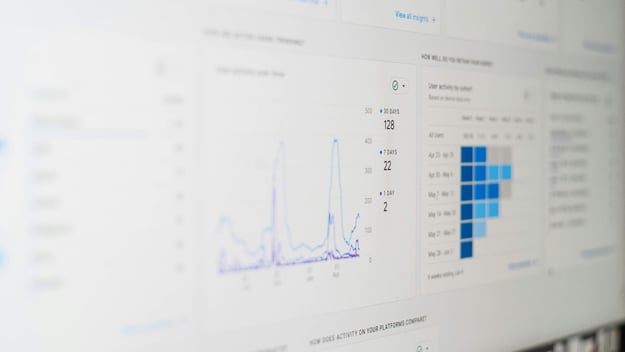
Your Dashboard Isn't the Problem. Your Interpretation Gap Is.
Monday morning. A facilities manager opens her dashboard. Occupancy numbers, desk booking rates, meeting room utilisation. It's all there. The numbers look fine. But somewhere in the back of her mind, she knows they don't tell the whole story, because three employees complained last week about not being able to find a meeting room, and two team leads said their floor felt overcrowded on Tuesday afternoon.
The data and the experience don't match. And nobody has time to figure out why.
This is the interpretation gap. And for most workplace and facilities teams, it's where good data quietly goes to waste.
More data was supposed to help. So why doesn't it?
The assumption built into most workplace technology decisions is that visibility equals clarity. If teams can see the data, they'll know what to do. So organisations invest in sensors, booking platforms, energy management tools, and dashboards that pull it all together.
And then they get stuck.
"Those dashboards tell everybody what happened," says Nate Colle, Head of Professional Services and Operations at Metrikus. "Not necessarily why it happened, what's important about it, or what to do next."
That's the gap. Dashboards are designed to surface information. They weren't built to interpret it. The step between seeing data and making a decision still requires someone with the time, the skills, and the context to bridge them. For most workplace and facilities teams, that person doesn't exist. There aren't enough hours in the day to fill that role on top of everything else.
"Those dashboards tell everybody what happened. Not necessarily why it happened, what's important about it, or what to do next."
- Nate Colle, Head of Professional Services and Operations, Metrikus
The analyst most teams don't have
Research from IDC consistently finds that data professionals spend upwards of 80% of their time finding, preparing, and validating data, leaving less than 20% for actual analysis. For facilities teams doing this work without a dedicated data resource, the ratio is likely worse.
The reality for most teams looks like this: the building is busy, with operational decisions to make, issues to respond to, and employees to support. Nobody has two hours to sit with a dashboard and dig for patterns. The data gets collected, the system keeps running, and the insight stays buried.
"If you wanted deeper insights, you needed somebody with that specialist expertise to interpret the data and translate it into something useful," says Colle. "But that model doesn't really scale, especially now, where buildings can collect and generate so much more data than most organisations can realistically analyse manually."
This is the quiet reality of workplace data in 2026. Not a shortage of information. A shortage of capacity to use it. According to Gartner, poor data quality and the inability to act on it costs organisations an average of $12.9 million per year, a figure that includes not just errors, but the operational drag that comes from data people can't trust or act on quickly enough.
What the interpretation gap actually costs
When the gap goes unfilled, it shows up in specific ways.
Problems get noticed after they've already landed. Employees complain about overcrowding before anyone has reviewed the data. Cleaning resources are in the wrong place at the wrong time because nobody spotted the occupancy pattern that would have predicted the demand. Booking systems show meeting rooms fully reserved all day while half of them sit physically empty. The insight that should trigger a policy change is sitting in a report nobody has read.
The team isn't failing. It's busy. The building is running. But it's running on lag.
"Nobody notices a building that is running smoothly," says Colle. "But everybody will notice one that is not running smoothly."
This is the practical cost of the interpretation gap: not data that's wrong, but decisions that are slower, later, and less confident than they could be. The information exists. The problem is that no one has the capacity to turn it into action.
"Nobody notices a building that is running smoothly. But everybody will notice one that is not running smoothly."
- Nate Colle, Head of Professional Services and Operations, Metrikus
How AI closes the gap
TAI doesn't fill the role of a data analyst. It removes the need for one.
The shift is straightforward in principle: instead of data sitting in a dashboard waiting to be interrogated, AI surfaces what matters in plain language: what happened, why it's significant, what to do about it. Without anyone having to ask.
"AI isn't about buildings running themselves or replacing people," says Colle. "It's about helping people get to answers faster."
That speed matters in practice. A facilities manager can type a question. What was the busiest floor last Tuesday? And get an immediate, accurate answer. No analyst required. No dashboard to build. No time spent working backwards through rows of data. The question is the same one they'd have asked a colleague. The difference is that the technology now answers it the same way.
It also means teams can go further. Anomaly detection flags unusual patterns before they become complaints. Proactive alerts surface emerging issues in real time. The team that was always reacting now has the means to get ahead.
This is what Metrikus is built to do: close the distance between the data and the decision, at the speed operational teams actually need.
"AI isn't about buildings running themselves or replacing people. It's about helping people get to answers faster."
- Nate Colle, Head of Professional Services and Operations, Metrikus
From "what am I looking at?" to "what should I do next?"
The real shift isn't technical. It's conversational.
When data requires a specialist to interpret it, most people disengage. They stop looking at dashboards they don't have time to understand. They make decisions on instinct because that feels faster than trusting numbers they're not sure about.
When the data explains itself, that changes entirely.
"We're really on the edge of data actually being able to explain itself," says Colle. The conversation in operational meetings stops being about what the numbers say and starts being about what to do about them. A non-technical person can engage with building intelligence the same way they'd engage with any other piece of clear information: by acting on it.
The people responsible for running buildings were never trying to become analysts. Their job is to identify problems and make decisions. The interpretation gap has always been the thing standing in between.
It's closable. And for workplace teams that close it, the change in how they operate is immediate.
See how Metrikus closes the interpretation gap. Explore the platform