When it comes to improving space utilization in your building, real-time occupancy monitoring is absolutely key. But what’s even more important is having a dashboard that can bring this data together and display it in a clear, digestible and actionable way.
In this blog post, we explore how our Occupancy Panel can unlock the power of your building’s data and transform your understanding of space utilization.
Why is occupancy monitoring so valuable?
Without access to occupancy data, understanding how a building is being used by occupants is a complete guessing game. This is why occupancy monitoring is so valuable: it allows you to track real-time usage in your space with a high degree of accuracy.
However, using IoT sensors to track occupancy levels is actually the easy part in many ways. The harder part is centralizing this data and bringing you actionable insights so that you can actually improve your space utilization.
Luckily, the Metrikus platform is here to do all the hard work for you. By simply logging into our platform, you can get all the data you need at your fingertips and make sure your building is being used safely and efficiently.
- Check out our blog post exploring why occupancy monitoring in the workplace is essential
-png.png?width=450&name=How%20to%20unfurl%20image%20(2)-png.png)
Why choose Metrikus?
1. Connect any sensorWe have a whole catalogue of sensors integrated into our platform, so we always pick the best sensors for your specific requirements.
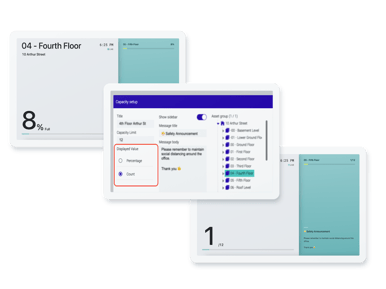
2. Empower your occupantsOur Kiosk Mode allows you to set up tablets or screens around your office and share important metrics with your occupants. This empowers them with the information they need to decide whether or not to come into the office, and when they are in the office, use the space in the safest and most effective way possible.
3. See data the way you want to see itIt’s easy to overlay different data sets – you can see occupancy data along with other metrics like energy usage, indoor air quality and desk bookings to get a meaningful understanding of how your building is being used.
Getting to grips with the Metrikus platform
The Metrikus Occupancy Panel
Our Occupancy Panel gives you detailed information about occupancy and utilization across any building, floor or asset you select.
You can use it to get a high-level summary of your space, or choose to delve deeper into more customized analytics. The panel can also be extended to include trend analytics across different departments and buildings.
The Occupancy Panel can be broken down into five main subpanels:
- Occupancy overview
- Occupancy utilization chart
- Occupancy comparison
- Occupancy utilization by day or hour
- Meeting room utilization ranking
Keep reading to get a better understanding of how these panels work.
Occupancy overview
The occupancy overview does what it says on the tin – gives you an overview of occupancy levels across your space.
There are two key views you can pick from:
1. The desk view
2. The meeting room view
With the desk view, you can easily see which desks are vacant and occupied with our red, amber, green (RAG) system. And you can also see key information about average and peak occupancy levels.
One of our favorite features is that you can see the total cost of the workspaces you’ve selected – very helpful to see if you’re wasting money with loads of unused desks!
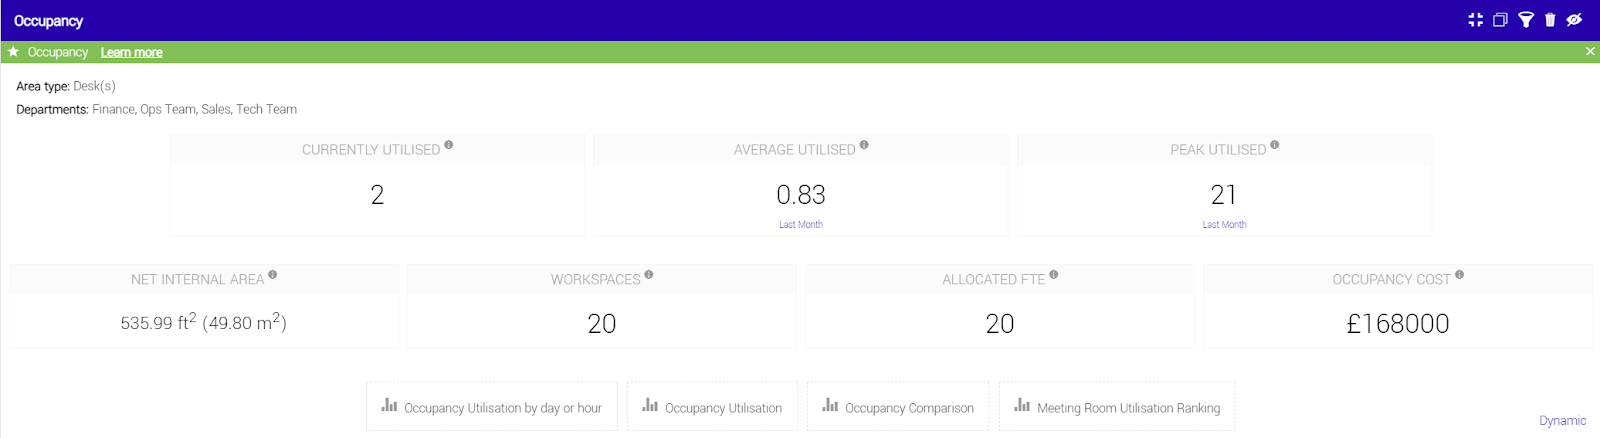
The meeting room view shows you helpful information like number of seats currently in use, average number of seats in use and peak number of seats in use.

Both views give you lots of filters to choose from. For example, you can see utilization from the last hour, 24 hours, week, month, or any other custom time period you might like.
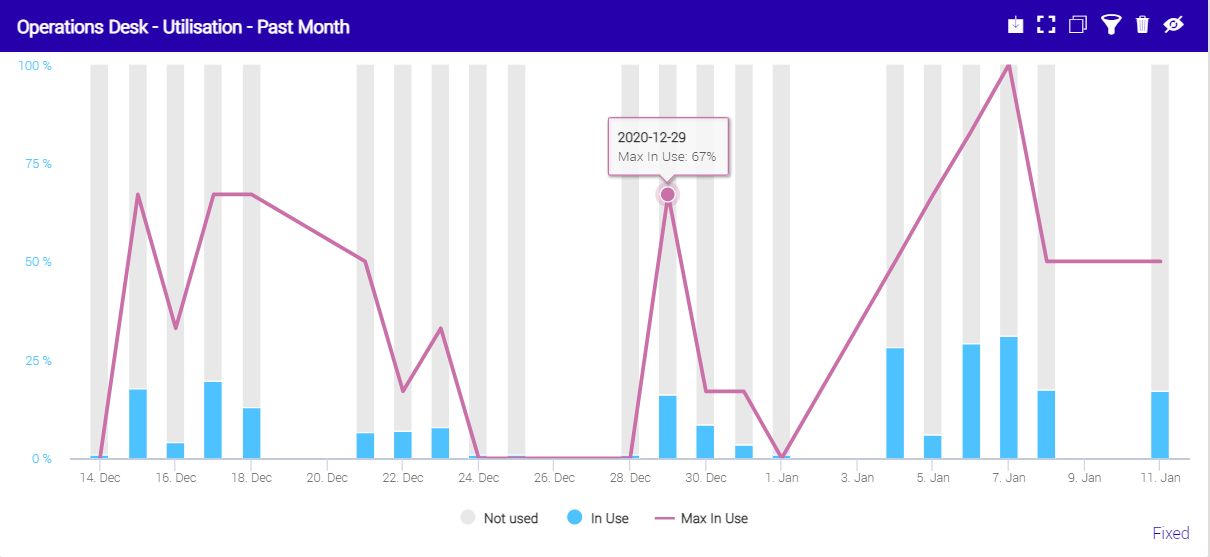
Occupancy utilization chart
Our occupancy utilization chart displays the peak and average utilization of an area over a chosen time period.
The average utilization is displayed in the bar, and peak utilization is shown by the line. A peak value of 100% shows that on at least one occasion during that time period, all of the seats were in use – probably not very likely since the start of the COVID-19 pandemic!
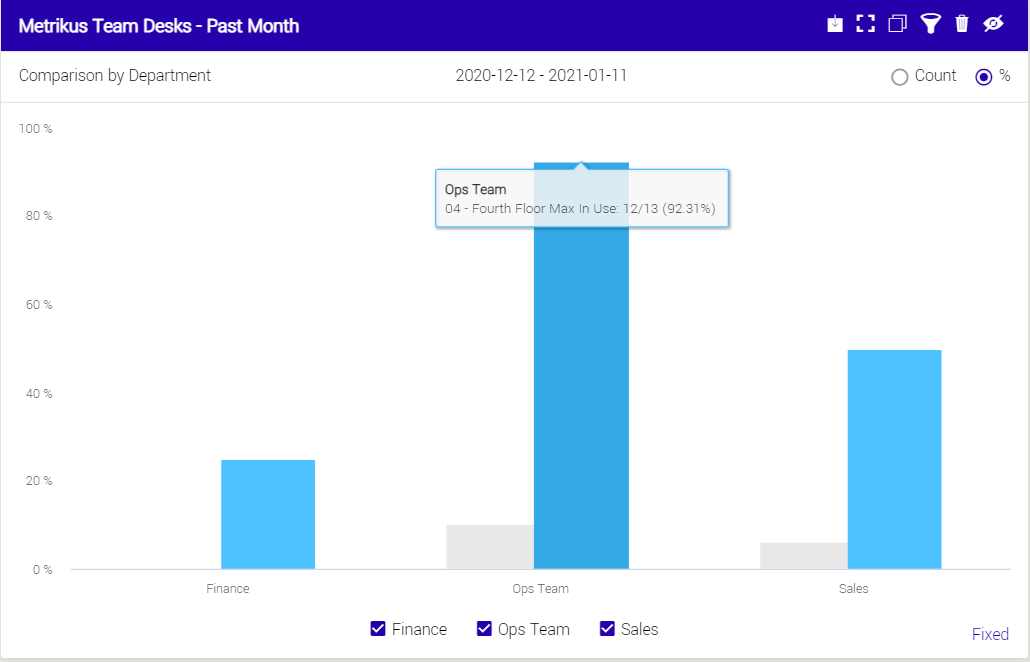
Occupancy comparison chart
The occupancy comparison chart helps you to compare average and peak utilization between different departments and locations. It’s easy to select the time period and specific hours you’d like to be analyzed.
And you can go as specific as you’d like with the comparison, like looking at which departments come in on different days. For example, the chart below shows that our Ops team spends much more time in the office than Sales or Finance!
Occupancy utilization by day or hour
If you want to understand your space utilization by either the day or the hour, this one’s for you.
Our charts make it easy to see which days of the week, and even which hours of the week are most popular. And you can also track the percentage change in utilization against different time periods.
We’ve found these charts really useful as more employees return to the office, as we can identify the most and least busy times in the office.

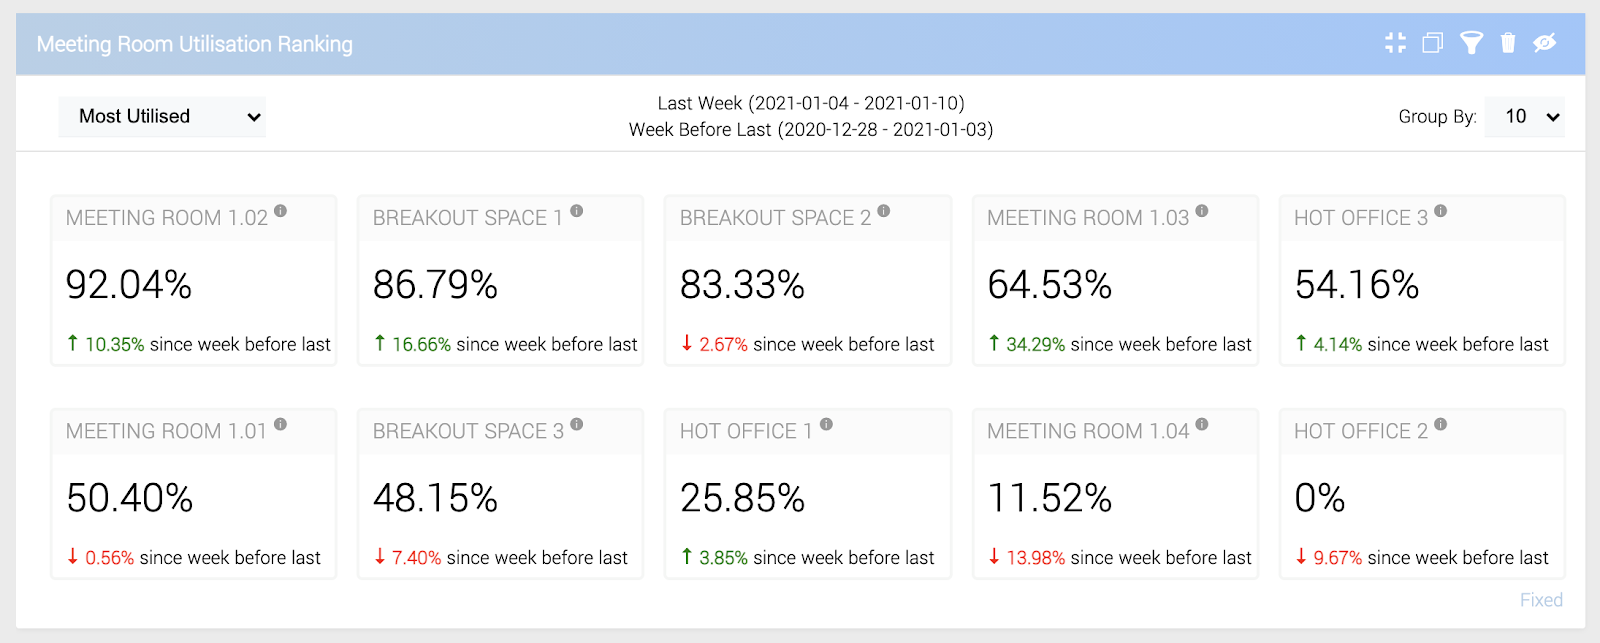
Meeting room utilization ranking
There’s nothing worse than paying for space that you’re not even using. Our platform makes it easy to rank your top and worst performing meeting rooms.
You can basically think of it like a league table, showing which meeting rooms are being used most effectively.
Collaboration is a big focus for employees returning to the office, so this data is definitely something worth keeping an eye on.
How to improve your space utilization?
As you can see, our Occupancy Panel gives you access to loads of useful information about how your space is being used.
By just glancing at one of our many charts, you can get an accurate understanding of occupancy levels in any given area at any different time. And once you’ve got this data, you can’t start making informed decisions about downsizing, reallocating space and creating a hybrid strategy that suits your employees and the space they work in.
Want to find out how our solution could help you? Book a demo with us to see our Occupancy Panel in action.